Q2/2026 MAFSI Business Barometer: Market Continues in Its 3-Year, Slow Growth/No Growth Pattern; Slight Improvement Forecasted for Q3/26


Market Continues in Its 3-Year, Slow Growth/No Growth Pattern; Slight Improvement Forecasted for Q3/26
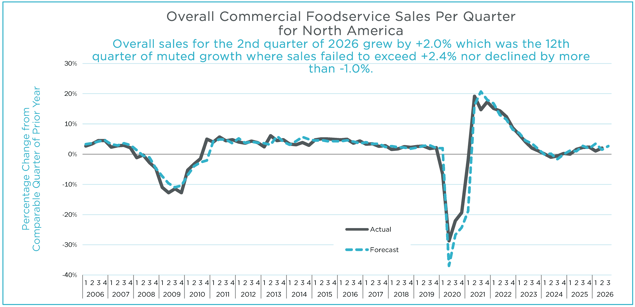
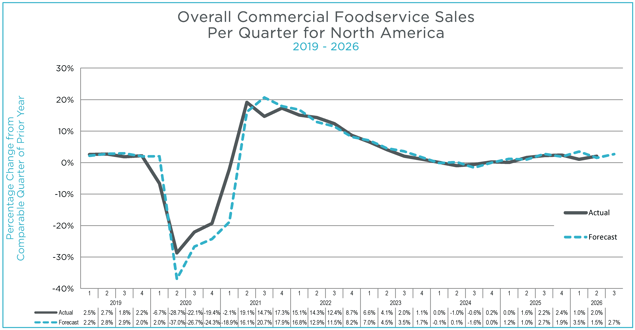
Overall sales for the 2nd quarter of 2026 grew by +2.0% which was the 12th quarter of muted growth where sales failed to exceed +2.4% nor declined by more than -1.0%.
See SpecPath Projects on Page 5
See the Q2 2026 Commercial Foodservice Business Barometer & 2026 Market Forecast
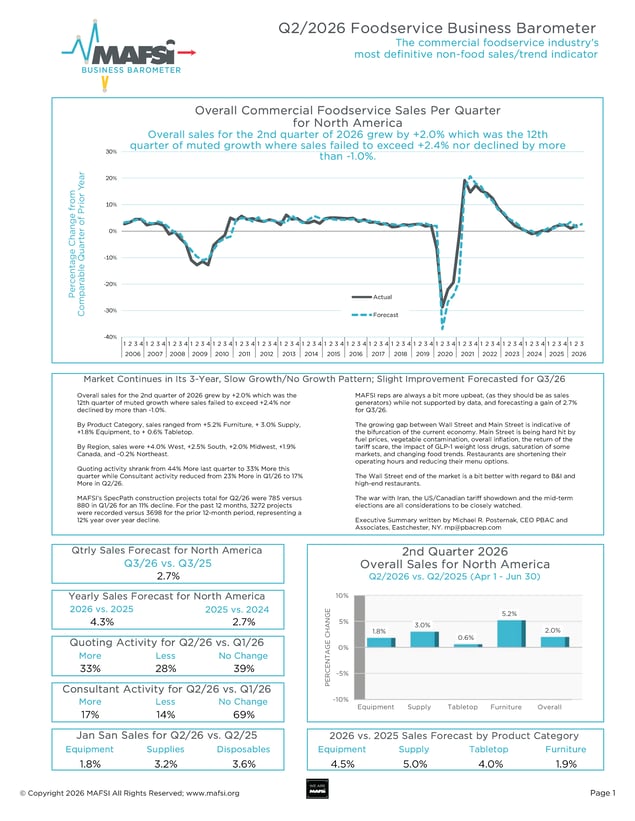
Overall sales for the 2nd quarter of 2026 grew by +2.0% which was the 12th quarter of muted growth where sales failed to exceed +2.4% nor declined by more than -1.0%.
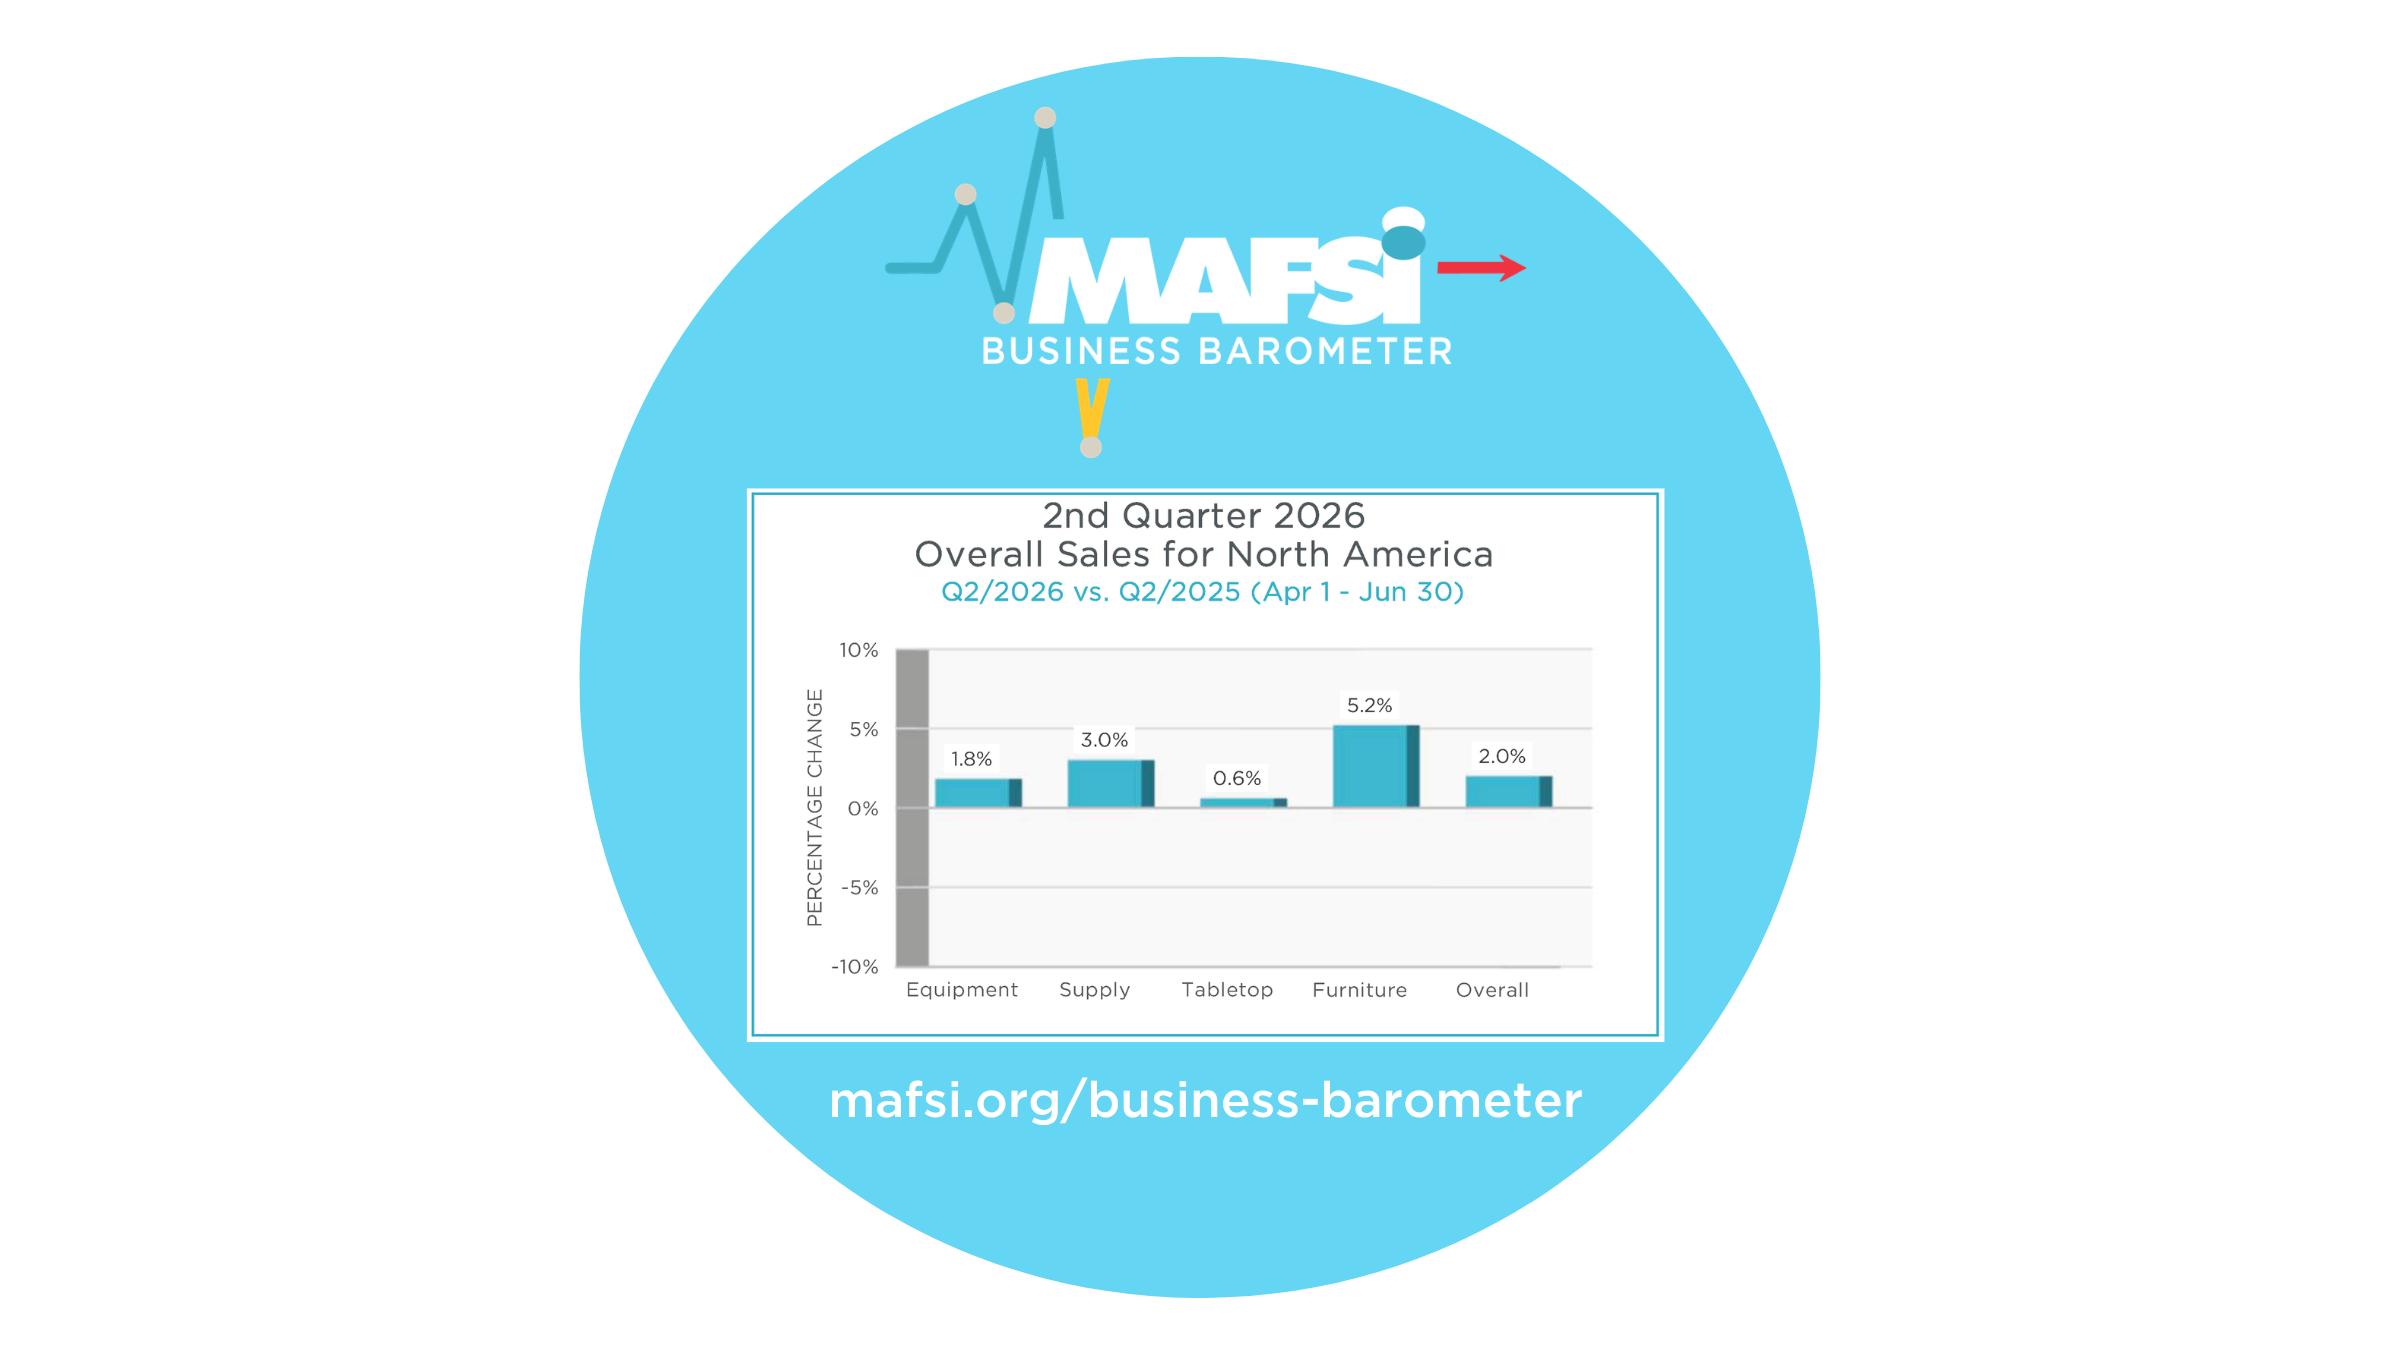
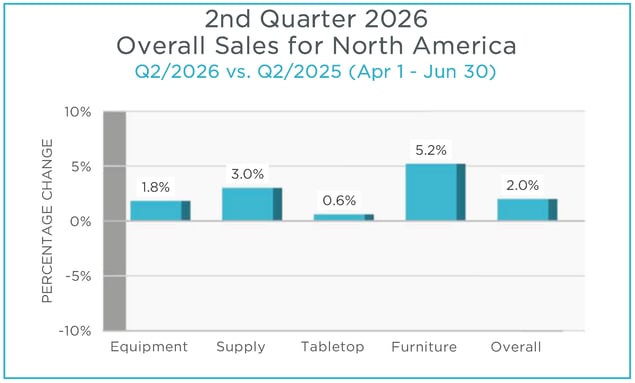
By Product Category, sales ranged from +5.2% Furniture, + 3.0% Supply, +1.8% Equipment, to + 0.6% Tabletop.
By Region, sales were +4.0% West, +2.5% South, +2.0% Midwest, +1.9% Canada, and -0.2% Northeast.
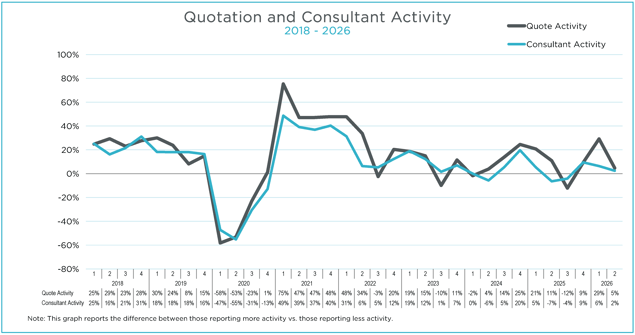
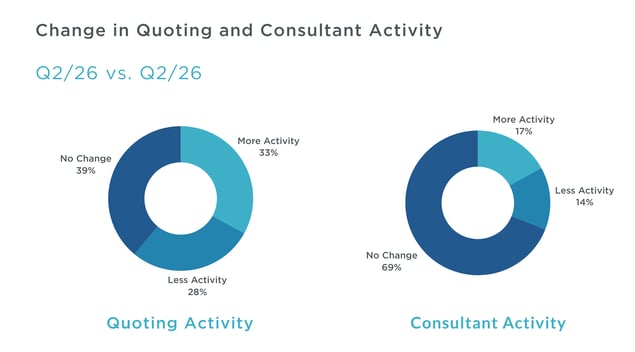
Quoting activity shrank from 44% More last quarter to 33% More this quarter while Consultant activity reduced from 23% More in Q1/26 to 17% More in Q2/26.
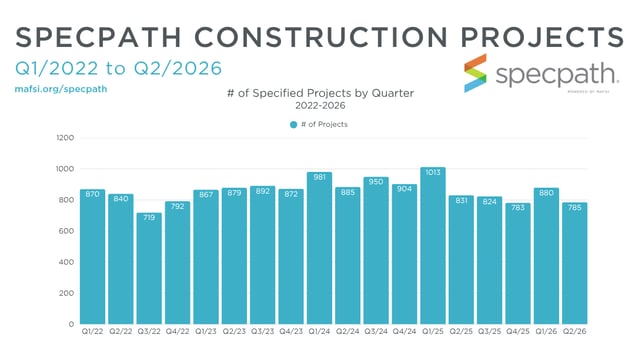
MAFSI’s SpecPath construction projects total for Q2/26 were 785 versus 880 in Q1/26 for an 11% decline. For the past 12 months, 3272 projects were recorded versus 3698 for the prior 12-month period, representing a 12% year over year decline.
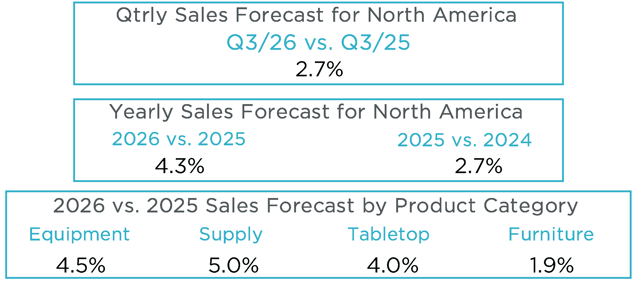
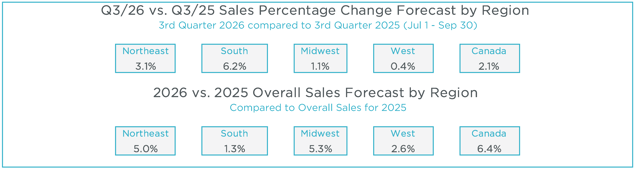
MAFSI Reps are always a bit more upbeat, (as they should be as sales generators) while not supported by data, and forecasting a gain of 2.7% for Q3/26.
The growing gap between Wall Street and Main Street is indicative of the bifurcation of the current economy. Main Street is being hard hit by fuel prices, vegetable contamination, overall inflation, the return of the tariff scare, the impact of GLP-1 weight loss drugs, saturation of some markets, and changing food trends. Restaurants are shortening their operating hours and reducing their menu options.
The Wall Street end of the market is a bit better with regard to B&I and high-end restaurants.
The war with Iran, the US/Canadian tariff showdown and the mid-term elections are all considerations to be closely watched.
Executive Summary written by Michael R. Posternak, Chairman of PBAC 3.0, Eastchester, NY 10709 mp@pbacrep.com.
See the Q2 2026 Commercial Foodservice Business Barometer & 2026 Market Forecast.

Comments